Guangzhou Cosmetics Manufacturing: Reading Capacity and Quality Numbers
Big factory numbers only become useful when you divide them down to the size of your own order. Published capacity is 160,000,000 units a year and about 200,000 a day across 35 automated lines, which is about 5,714 units per line per day. A 20,000-unit order is therefore a fraction of one working day, not a fraction of a year.
Key takeaways
- Published capacity: 160,000,000 units a year, about 200,000 a day, across 35 lines.
- That daily figure equals about 5,714 units per line per day.
- Quality figures include a 0.12% industry defect rate and 100% weight verification.
- Logistics are published as 98.5% on-time delivery with a 72-hour response.
A capacity number is a claim until you divide it
A capacity headline tells you the plant is large. It does not tell you what happens to your order. Division turns the headline into something checkable, and division is free. If a factory says it can make 200,000 units a day and you need 20,000, the order is one tenth of a day of output. The same move turns a yearly figure into a working-days figure and a line count into a per-line rate.
Run the same test on every candidate and the numbers become comparable. The point is not to doubt the figure but to place your order inside it, because a figure you can place is a figure you can plan against. A figure you cannot place is a story, and stories do not help a production calendar. Buyers who run this check early also avoid the common trap of choosing the largest plant and only then discovering that their order is too small for its schedule.
The factory figures worth testing
Four groups of numbers repay a quick check: capacity, filling, testing and delivery. Capacity tells you whether the order fits the day. Filling accuracy tells you how tightly the pack is controlled. Testing tells you what happens before release. Delivery tells you how often the plan holds. Each group answers a different question, and reading them together gives a fuller picture than any single headline.
A Guangzhou cosmetics manufacturer profile is only as useful as the numbers you can divide, so collect them in a fixed list and work down it. Keep the list short enough to finish in one sitting, because a figure you never test is a figure you never use.
| Figure | Published value | Test to run |
|---|---|---|
| Yearly output | 160,000,000 units | Divide by the daily figure to see the working days implied |
| Daily capacity | About 200,000 units | Divide your order by it to get days of plant time |
| Production lines | 35 automated lines | Divide daily output by lines for per-line output |
| Defect rate | 0.12% industry defect rate | Multiply your order size by 0.0012 |
| On-time delivery | 98.5% with a 72-hour response | Apply the rate to a sample of 200 shipments |
Turning a big number into an order-sized number
The yearly figure looks overwhelming and the daily figure is easier to use. Divide the yearly figure by the daily figure and you get 160,000,000 ÷ 200,000 = 800, which is the number of days of output the annual figure represents at that daily rate. That is a sanity check on scale, not a schedule, and it shows how a single annual headline can be split into something a buyer can hold in one hand. Zooming in this way is how a large plant becomes legible to a small order.
The number that actually matters is the per-line figure: 200,000 ÷ 35 ≈ 5,714 units per line per day. Once you hold that, any order can be placed against it in a single division. A 100,000-unit order becomes 100,000 ÷ 5,714 ≈ 17.5 line-days, and a 5,000-unit order becomes 5,000 ÷ 5,714 ≈ 0.9 line-days.
Worked example: a 20,000-unit order against the figures
Take an order of 20,000 units and the chart inputs: yearly output 160,000,000, daily capacity 200,000 and about 5,714 per line per day. Plant time is 20,000 ÷ 200,000 = 0.1 day, which is 0.1 × 24 = 2.4 hours. Spread across 35 lines the order is 20,000 ÷ 35 ≈ 571 units per line, and 571 ÷ 5,714 = 0.1 day, the same answer. Now apply the quality rate: at a 0.12% defect rate, expected defects are 20,000 × 0.0012 = 24 units, while a 200,000-unit order would carry 200,000 × 0.0012 = 240. Weight verification covers 100% of both orders. On delivery, 98.5% on-time means 200 × 0.985 = 197 shipments arrive on time out of a sample of 200, and 200 − 197 = 3 do not.
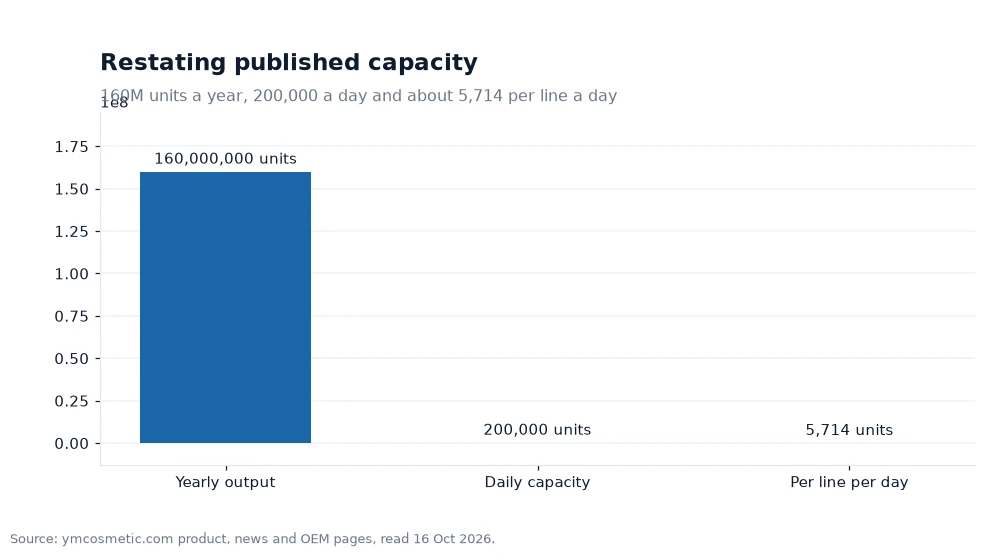
The two numbers to read together are the 200,000 daily figure and the 5,714 per-line figure. Their relationship is direct: 200,000 ÷ 35 ≈ 5,714, so the per-line figure is just the daily figure shared across the line count. Read them as one number in two forms, and the yearly figure as the widest zoom on the same capacity.
Checking quality and testing claims
Quality figures sit at the end of the line, not the start. The published list includes a 0.12% industry defect rate, ±0.2 ml filling accuracy and 100% weight verification, plus emulsification at 200 kg/hour with temperature held to ±0.5 °C. Those are the numbers that decide whether the last unit in the carton matches the first, and they are measured rather than estimated.
Testing adds a second layer: a microbial limit under 10 CFU/g, 24-hour accelerated incubation, ATP bioluminescence testing and 3D vision inspection. Ask which of these run on your category before you treat the list as a checklist for your order. A test that does not apply to your category is a reassuring line rather than a useful one, and a test that does apply is worth watching closely.
Reading delivery as a rate, not a promise
98.5% on-time delivery is a rate, and rates are best read over a run of shipments. A single late delivery does not disprove the rate, and a single prompt one does not prove it. Ask how a 72-hour response is measured so the number has a definition behind it, and ask which events count against the rate.
A factory that explains its figures this way is easier to plan with than one that repeats headlines. The explanation is the signal, and the arithmetic is the test. A rate you understand can be planned around, while a rate you merely admire cannot.
Frequently asked questions
How do you check a Guangzhou factory's capacity claim against your order?
Divide the order by the published daily figure: 20,000 units is 20,000 ÷ 200,000 = 0.1 of a day, and across 35 lines it is about 571 units per line.
What quality numbers does the site publish?
It publishes a 0.12% industry defect rate, ±0.2 ml filling accuracy, 100% weight verification, a microbial limit under 10 CFU/g and 98.5% on-time delivery.
What does the 98.5% on-time figure mean for a small order?
On 200 shipments, 98.5% is 200 × 0.985 = 197 on time and 3 late, so the figure is a rate to test, not a promise.
Test the numbers against one order
Pick one real order, run the divisions, and see whether each figure answers a question you actually have. The same method works on any candidate: capacity first, then filling, testing and delivery. Yunmei's OEM/ODM profile supports eye cream work and a men's care range, two categories where those figures meet a specific order. Ask which line would run the batch and what changeover that line needs, then confirm the packaging arrival date, because a plant-wide daily figure says nothing about a specific production slot. Those three answers turn a published capacity number into a workable schedule.
Capacity, minimums and testing windows in this article were sourced from the company's pages on 16 Oct 2026.[1]